
Research & Blogs

Limitations of Inflation Measures: Actual Inflation May Vary
Examining Inflation Measures
Having examined the main inflation measures, it is worth keeping in mind that these are statistical measures which necessarily rely on assumptions and methodological choices. These determinations can at times understate inflation levels. Moreover, the actual inflation that any particular individual experiences is entirely reliant on the unique circumstances of the individual. In other words, my inflation and your inflation may feel different… sometimes very different.
More on Core
For most observers, the whole idea that policy makers focus on core inflation excluding things like food and energy misses the point. After all, most of us eat, heat and cool our homes, and use energy to get from point A to point B. Nonetheless, core measures are what matter to policy makers.
For perspective, the latest Consumer Price Index(CPI) reported an annual increase in overall prices of 8.6%. In comparison, excluding food and energy, core inflation rose only 6%. In the grand scheme of things, a 2.6% difference may not sound like much, but consider the fact that cost of living increases and government salary and benefits rely on core measures. Therefore, such a difference can have a real impact on society.
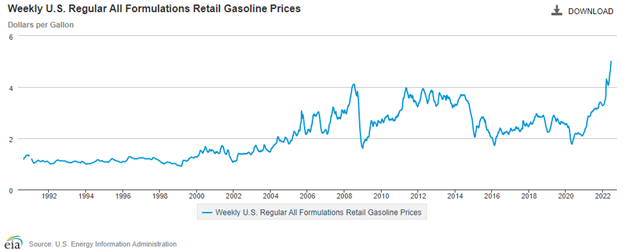
For example, social security benefit payments were increased by 5.9% for 2022. Do you think pensioners are pleased to the core with this increase or left to wonder how to pay at the pump? Keep in mind that at the time of this writing, the national average price for regular gasoline is $4.897 per gallon up from $3.095 per gallon just one year ago – an increase of over 58%. The U.S. Energy Information Administration maintains a history of weekly gasoline prices going back to 1990. Consumers are currently facing these record high prices, but of course, these aren’t included in the core measures that matter.
A Measure for Me
The fact that policy makers make decisions using a more stable data series can certainly be justified when those decisions are directed at long-term stability. Still, for the average investor, individual circumstances make a difference when it comes to savings and portfolio decisions. For a retired professional with a comfortable nest egg, residing in a fully owned apartment in an urban center, increases in rents, gasoline and even food may not make a difference in terms of budget.
For the single mother with a baby on the way who is paying rent, saving for college and driving to work each day, price increases may be significant enough to inspire changes in lifestyle (carpooling, fewer meals out, less protein in her diet, etc.)
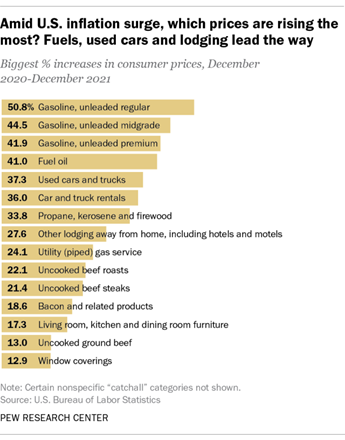
Using the current CPI weights for housing, transportation, food and education, a hypothetical example of a student attending NYU and commuting by car to work part time would be facing an annual increase in prices over 28% using the following conservative assumptions:
- Manhattan rents increase by 38%
- Gasoline prices are up 58%
- Food prices are up 9.4%
- NYU cost of attendance up 3%
- The student had no medical expenses
- All work and no play
- No new clothes purchased
- Nor anything else
- CPI weight for housing is 42.4%
- CPI weight for transportation is 18.2%
- CPI weight for food is 14.3%
- CPI weighting for education is 6.4%
- CPI weight for medical is 8.5%
- CPI weight for recreation is 5.1%
- CPI weight for clothes is 2.5%
- CPI weight for other is 2.6%
Given the above assumptions, 28% inflation may even be conservative. Now, imagine that the student’s car breaks down and needs to be replaced. Finding one in and of itself may be a challenge given changes in commuting patterns post-COVID and limited inventory due to supply chain disruptions. And after finding one, the increase in sticker price may come as a shock. Manheim tracks prices of used vehicles adjusted for mileage. As shown in the chart below, inflation for this item has reached unprecedented levels since the inception of the index.
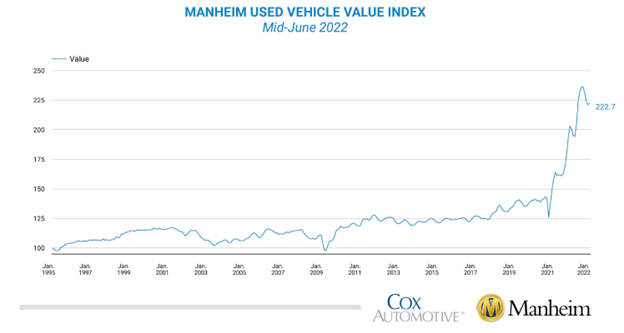
Tracking used car prices since 1998, Manheim makes adjustments for seasonality, make/model and mileage. On that basis, a used vehicle is 12.4% more expensive now than a year ago. So, much for core, or headline for that matter. The consumer that needs a car has few options.
Indeed, the student here faces a very different sense of inflation. It’s hard to argue that core inflation means much in this example or probably for most readers of this piece. However, even at low levels, inflation is always there eroding the purchasing power of cash.

Investors tend not to notice this constant threat, until rates of inflation spike, but since the 1930s, the U.S Dollar has lost 99% of its value compared to gold with the bulk of the loss (over 90%) coming since August 1971 when President Nixon removed the convertibility of USD to gold. Given the near total loss of purchasing power over time, splitting hairs over core versus headline inflation seems moot.
Muted Inflation Measures
When it comes to measuring inflation three other factors may moderate reported inflation and merit mention. The first is owners’ equivalent rent. In 1983, the BLS “switched from using home prices – which also included mortgage payments and maintenance costs – to using rental prices to gauge housing.” In the CPI calculation, owners’ equivalent rent accounts for 32% of the basket, while in the PCE calculation (used by the FOMC to make interest rate decisions), owner’s equivalent rent contributes just 11% to the index. The surveys to collect data on rents are conducted less frequently (with a gap of up to six months), and as a consequence will lag when capturing short-term price jumps.
As mentioned earlier, many consumers devote a much larger share of their income to owning a piece of the American dream. The second subtlety of the CPI calculation is referred to as hedonic price adjustments.
To explain this concept, a washing machine serves well as an example. If a given maker of washing machines updates a model annually and adds a new delicate cycle but does not change the sales price, this lowers CPI. Paying the same amount for more features (even if the consumer does not use them) is tantamount to deflation when it comes to calculating inflation indexes.
The third calculating technique that may mute reported inflation was instituted in 1999 and assumes consumers will substitute for less expensive goods when prices rise. “The government estimated this would reduce inflation by .02 percentage points per year.” While it doesn’t sound like much for a single period, overtime this can make a real difference. Changes to the statistical measures used to calculate inflation are instituted with some regularity. Right now, with inflation measures at historically high levels, consumers are left to wonder why their live experience is so different from published inflation levels, and are forced to question whether changes in calculation methods are rendering reported inflation numbers artificially low.
Making Measures
Muted or not, whether one relies upon CPI or PCE, whether core or headline matters more, or whether the price of a single big-ticket item is a determining factor, investors and savers can do something to preserve purchasing power. Portfolio diversification and appropriately sized investments in real assets have historically protected against inflation.
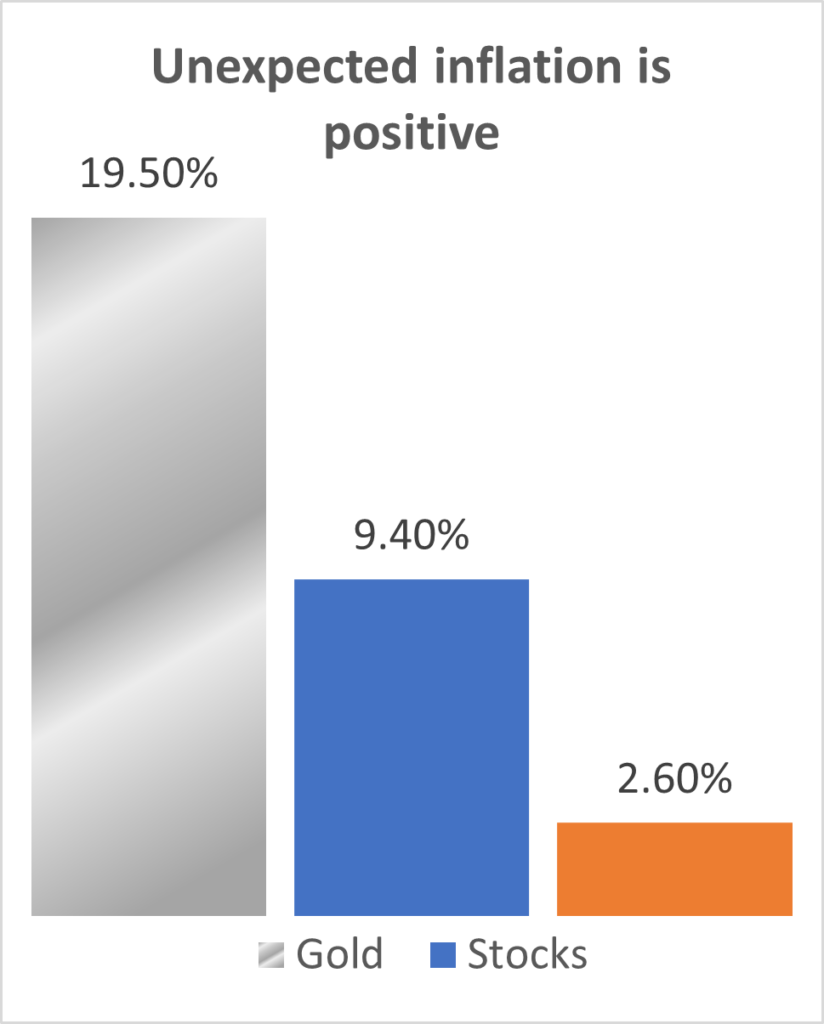
Gold with a low historical correlation to market beta (stocks and bonds) offers a diversifying addition to most portfolios that actually adds to returns while lowering risk. And perhaps most germane to the conversation, gold has done very well during inflation, particularly at times when inflation exceeded normal expectations. Now that measures up.
Start Investing Now
United States
1221 Brickell Avenue, Suite 900
Miami, Florida 33131
+1 (786) 233 5549
Channel Islands
IFC 5
St. Helier, Jersey JE1 1ST
Channel Islands
Abu Dhabi
Regus Al Maqam Tower
Al Maryah Island, Abu Dhabi Global Market Square
Al Maqam Tower, 3412Register13, 34th Floor
Abu Dhabi, United Arab Emirates![]() Whatsapp: +971.55.640.0950
Whatsapp: +971.55.640.0950
Copyright © 2022 Gilded. All Rights Reserved. Privacy Policy | Terms of Use