
Research & Blogs

Inflation Measures are up, by all Measures
Despite the documented inflation measures, inflation is enigmatic, difficult to measure, and even harder to predict. This is true for the uninitiated, market professionals and policy experts alike. The current chair of the Federal Reserve, Jerome Powell, serves as a case point. He proclaimed the onset of inflation as “transitory” in May of 2021 and in the face of continuing and rising inflation had to reverse course in November of 2021. The former investment banker capitulated saying, “it is probably a good time to retire that word.”
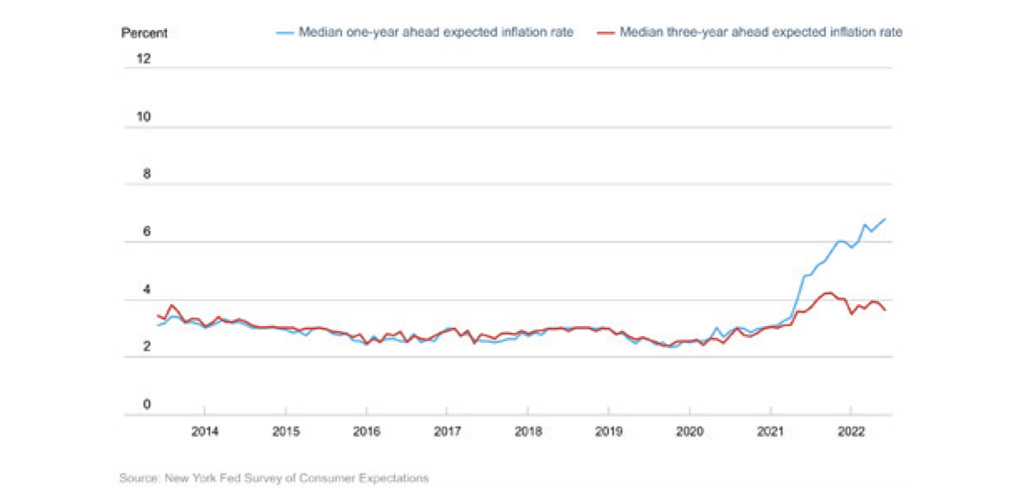
Indeed, inflation can be persistent. Once it escalates, it can alter expectations and the anticipation of continually higher prices starts to breed higher prices in a vicious cycle. As seen in the accompanying chart, inflation expectations have spiked higher in recent months. Expectations, however, are not real inflation and inflation doesn’t affect everyone equally. For those that borrow, inflation is a boon. Fixed amounts of debt due in the future become easier to repay as incomes and prices rise over time. For those living on a fixed income however, inflation can mean difficult budgetary choices.
The Main Inflation Measures
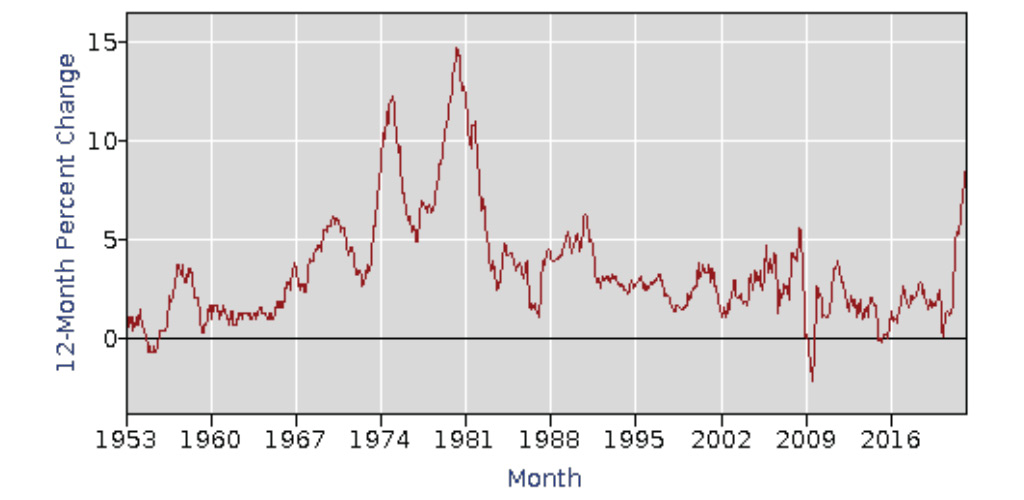
When it comes to inflation, economists and policy makers rely on inflation measures that look at the prices of goods and services in aggregate. The Consumer Price Index (CPI) is the preferred measure in the United States and is deployed by the Bureau of Labor and Statistics (BLS). From the attached chart of annual changes in the CPI index, we can see that current levels are the highest they have been since 1981. This is commanding the attention of both policy makers and the general public.
Each month, the BLS issues a report on the change in the aggregate price of a defined basket of goods and services to reflect what is “experienced by consumers in their day-to-day living expenses.” The idea of prices in aggregate is an important one to keep in mind since a significant change in the price of a single good can make headlines (e.g. gasoline), but it is an overall basket of goods weighted according to share of spending that holds sway with many civil servants.
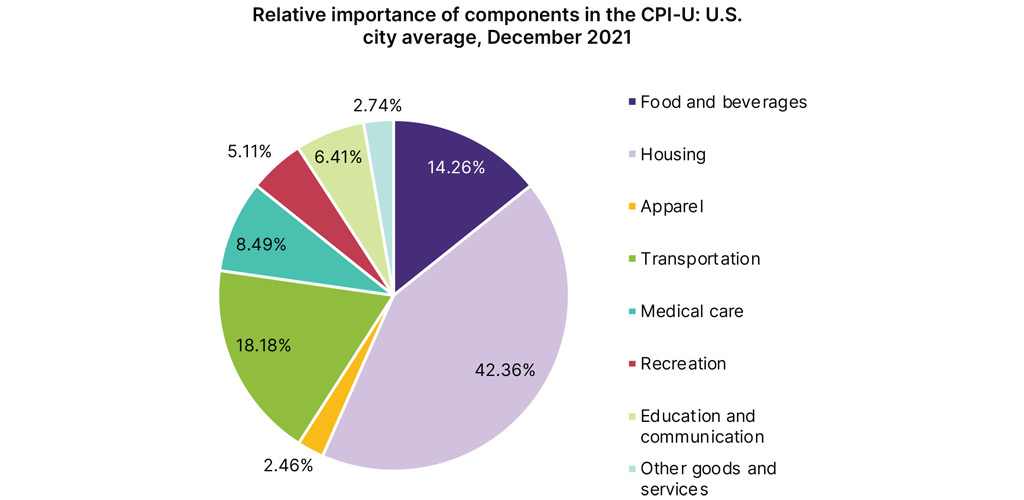
The BLS updates the weighted importance of items in the aggregate basket periodically. Here (as shown in the accompanying chart) are the current weightings, last updated at the end of 2021. The next planned update is scheduled for January 2023.
Evaluating inflation measures is a major undertaking. Since it would be impractical to calculate the change in price for every good or service, estimates are necessary. Even if price information for every good and service were to be collected, choices would still need to be made as to whether to include only goods actually purchased, or to include even those unsold. With such magnitude and complexity, inflation becomes a statistical endeavor.
To calculate the CPI, the BLS collects about 94,000 prices each month, mostly through visits by CPI data collectors to brick and mortar stores with the remainder collected by telephone or website. “BLS has classified all expenditure items into more than 200 categories, arranged into eight major groups (food and beverages, housing, apparel, transportation, medical care, recreation, education and communication, and other goods and services).
For each of the item categories, using scientific statistical procedures for inflation measures, the Bureau chooses samples of several hundred specific items within selected business establishments frequented by consumers to represent the thousands of varieties available in the marketplace.” Once the data are collected, adjustments are made to exclude volatile components like food and energy. It is these adjusted inflation measures upon which policy makers tend to rely.
The Fed’s Inflation Measures
The Federal Reserve, in particular the decision making Federal Open Market Committee, prefers different inflation measures called the Personal Consumption Expenditures index calculated by the Bureau of Economic Analysis and sometimes referred to as the GDP price deflator.
There are some subtle differences in how the PCE is calculated when compared to the CPI, differences worth understanding given the importance of the PCE when it comes to policy and the prevalence of inflation in a world of fiat money. First, the PCE considers substitution of one good for another as relative prices change. For example, consumers may substitute chicken for beef or to buy a generic rather than brand name item.
These choices, made in real-time may introduce a lag in the calculated index when prices rise. Also different, the weights of the PCE are derived from surveys of business rather than surveys of consumers as with the CPI. And notably, the CPI is “derived only from out-of-pocket expenses paid for by consumers. By contrast…the PCE index includes those services purchased out of pocket by consumers and those services paid for on behalf of consumers—for example, medical care services paid for by employers through employer-provided health insurance, as well as medical care services paid for by governments through programs.”
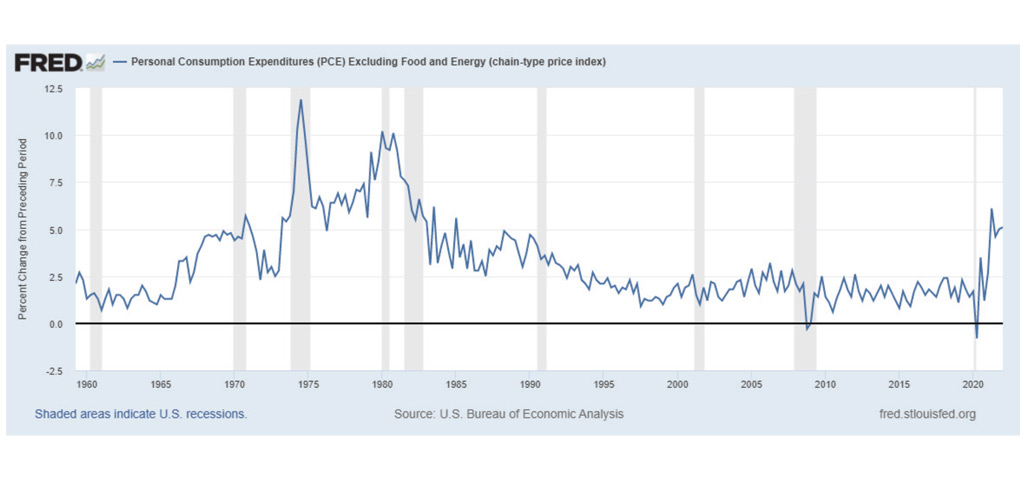
Despite the differences in calculation method and nominal index level relative to history, the PCE, like the CPI, is currently at the highest levels seen since the 1980s. From a global perspective, the high rates of inflation currently seen in the U.S. are not unique. In fact, in a study of the increase in aggregate levels of consumer prices in 111 economies performed by Deutsche Bank, the U.S. is 48th on the list (down from 28th of 116 a year ago).
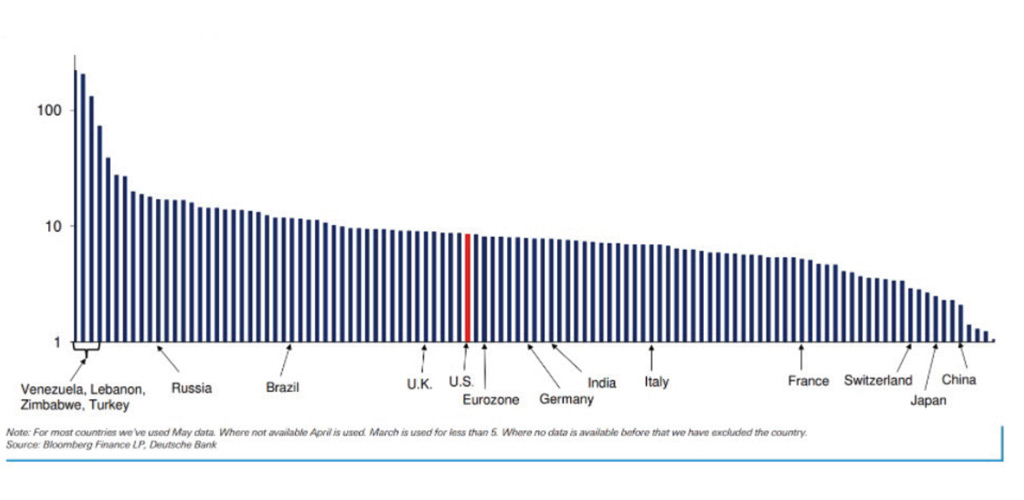
In Europe, the wide range in inflation levels across the countries in the common market presents a unique challenge for the European Central Bank that manages only a single interest rate for the Euro. The chart above highlights that France, Italy and Germany have current inflation levels below the Eurozone average. This implies that other Eurozone members have much higher levels.
All that being said, inflation is at historically high levels, no matter how it is measured. Actual inflation may in fact be even higher than these measures suggest. There is a fair amount of debate about the potential for the methods used in these calculations to understate inflation. We discuss these limitations in detail in a forthcoming blog post.
Start Investing Now
United States
1221 Brickell Avenue, Suite 900
Miami, Florida 33131
+1 (786) 233 5549
Channel Islands
IFC 5
St. Helier, Jersey JE1 1ST
Channel Islands
Abu Dhabi
Regus Al Maqam Tower
Al Maryah Island, Abu Dhabi Global Market Square
Al Maqam Tower, 3412Register13, 34th Floor
Abu Dhabi, United Arab Emirates![]() Whatsapp: +971.55.640.0950
Whatsapp: +971.55.640.0950
Copyright © 2022 Gilded. All Rights Reserved. Privacy Policy | Terms of Use